
Most professionals who use Excel daily are working at about 20 percent of what the software can actually do. Data entry, basic formulas, and simple formatting, the kind covered in a foundational Excel course in Singapore, are useful starting points. But they are not what separates a capable analyst from a productive one in a Singaporean corporate environment
Advanced Excel skills cover a different category of work entirely. Instead of typing data manually, professionals automate repetitive tasks. Instead of reading through hundreds of rows, they summarize thousands of records in seconds. Instead of sending static tables to management, they build live dashboards that update with a single click.
The gap between basic and advanced Excel is not about complexity. It is about knowing which tools exist and how to apply them to workplace problems. This guide covers five core skill areas that define advanced Excel training topics in structured professional courses: advanced formulas, pivot tables, Power Query, dashboard creation, and forecasting tools.
Each section explains what the skill does, how it works, and where it applies in actual Singapore business environments.
Skill 1: Advanced Formulas and Functions
Formulas at the basic level handle straightforward calculations. Advanced Excel formulas and functions handle something more demanding: pulling specific data from large sets, applying conditions across multiple columns, and returning results that update automatically when the source data changes.
These are the four functions that appear most frequently in professional Excel work:
XLOOKUP
XLOOKUP is the current standard for lookup operations. It searches a range for a value and returns a corresponding result from another column. Unlike older lookup functions, XLOOKUP works in both directions, handles errors automatically, and does not require the lookup column to be on the left side of the data.
A Singapore procurement team managing 5,000 product SKUs would use XLOOKUP to pull unit prices from a master price list into a purchase order sheet automatically, without manual cross-referencing.
INDEX MATCH
INDEX MATCH combines two functions to create a flexible lookup that works across any column arrangement. INDEX returns the value of a cell at a specific position. MATCH finds the position of a value within a range.
Together, they handle lookup scenarios where XLOOKUP is not available and where data structures change frequently. Finance teams working across legacy Excel versions in Singapore corporate environments still rely on INDEX MATCH for payroll reconciliation and cost allocation tasks.
SUMIFS and COUNTIFS
SUMIFS adds values that meet multiple conditions. COUNTIFS counts entries that meet multiple conditions. Both functions replace long nested formulas with a single structured calculation.
A sales operations analyst tracking monthly revenue by region and product category would use SUMIFS to calculate totals for each combination without creating separate sheets or manual filters.
Nested IF
A nested IF places one IF statement inside another to handle multiple possible outcomes. A basic IF checks one condition. A nested IF checks several in sequence.
An HR coordinator calculating performance ratings across five bands would use a nested IF to assign labels based on score ranges without manually reviewing each record.
Workplace data in Singapore rarely fits a single condition. Professionals moving from an intermediate-advanced Excel course into full professional use will encounter all four of these functions within the first few weeks of applied work. Advanced Excel formulas and functions give professionals the tools to handle that complexity without spending hours on manual calculations.
Skill 2: Pivot Tables and Pivot Charts
Raw data in Excel is rarely ready for a management report. It sits in rows, sometimes thousands of them, with no structure that makes performance visible at a glance. Excel pivot tables for data analysis solve this problem without requiring a single formula.
A pivot table reads a data set and reorganizes it into a summary based on categories the user selects. A sales file with 10,000 transaction rows can be summarized by region, by month, by product line, or by sales representative in under a minute. The original data stays untouched.
How a pivot table is built:
Select any cell within the data range, go to Insert, and click PivotTable. Excel asks where to place the table. The field list on the right shows every column header from the source data. Dragging fields into Rows, Columns, Values, or Filters areas controls how the summary is organized.
A Singapore retail business tracking daily sales across 12 outlets would drag the outlet name into Rows, the product category into Columns, and the sales value into Values. The result is a cross tabulated summary showing every combination without manual sorting.
Pivot Charts
A pivot chart is a visual linked directly to a pivot table. When the pivot table filters change, the chart updates automatically. This removes the manual step of rebuilding charts every time the data view changes.
Pivot charts for beginners start with bar and column charts linked to region or category summaries. More experienced users add slicers to allow management to click through different views without touching the underlying table.
Excel pivot tables for data analysis are used in finance, operations, HR, and sales functions across Singapore's corporate sector. They are one of the most requested skills in data-related job descriptions at the mid-level and above.
Skill 3: Power Query for Data Cleaning and Automation
Most Excel users spend a significant portion of their working time doing the same preparatory work before any analysis can begin. Copying data from multiple files, removing duplicates, fixing inconsistent formats, and merging sheets manually. Power Query in Excel automates all of this.
Power Query is a built in Excel tool that connects to data sources, cleans the data according to rules set by the user, and loads the result into a usable format. Once the process is set up, refreshing it takes one click regardless of how much the source data has changed.
Core Power Query operations:
Removing duplicates:
Power Query identifies and removes duplicate rows based on selected columns. A customer list pulled from two separate systems with overlapping records is cleaned in seconds.
Merging sheets:
Multiple files or worksheets with the same structure can be combined into a single table automatically. A Singapore finance team receiving monthly expense reports from 10 departments no longer needs to copy and paste each sheet manually.
Standardizing formats:
Inconsistent date formats, extra spaces in text fields, and mixed capitalization are fixed through transformation steps that apply to every row in the data set.
Splitting and reshaping columns
A single column containing full names can be split into first and last name columns. A column with combined product codes and descriptions can be separated into distinct fields for analysis.
The key difference between manual data cleaning in Excel and Power Query is repeatability. A manual process has to be repeated every time new data arrives. A Power The query process runs again with one click and applies every transformation step in the correct order automatically.
For operations staff, finance teams, and business analysts in Singapore handling regular data feeds, Power Query in Excel removes hours of preparation work from monthly reporting cycles.
Skill 4: Dashboard Creation and Data Visualization
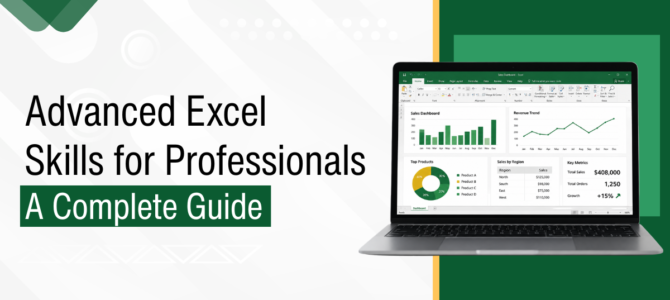
A table full of numbers tells a story that most stakeholders will not read. A well built dashboard tells the same story in under 30 seconds. How to build a dashboard in excel is one of the most searched advanced skills among Singapore professionals preparing for analyst and reporting roles.
A functional Excel dashboard combines three elements: charts that update automatically, KPI cards that show key figures at a glance, and interactive controls that let users filter the view without editing the underlying data.
Dynamic Charts
A dynamic chart is linked to a data range that updates as new records are added. When the source data changes, the chart reflects the change without rebuilding. This is the foundation of any live reporting dashboard.
KPI Cards
A KPI card is a formatted cell or group of cells that displays a single key figure prominently. Total revenue, month-on-month growth, and outstanding invoice count are common KPI card values in Singapore finance dashboards.
Slicers
Slicers are visual filter buttons that sit on top of a dashboard. Clicking a slicer button filters every connected chart and pivot table simultaneously. A regional sales dashboard with slicers for quarter, product category, and outlet lets a manager explore the data without touching any formula or filter menu.
Excel data visualization techniques at the advanced level also include conditional formatting rules that highlight cells based on thresholds, sparklines that show trends in a single cell, and custom number formats that display figures clearly without clutter.
Building a dashboard from scratch requires combining pivot tables, named ranges, dynamic charts, and slicers into a single sheet layout. The process teaches every major advanced Excel skill in a practical context, which is why dashboard projects are a standard part of structured advanced Excel training topics.
Skill 5: Data Analysis and Forecasting Tools
Planning decisions in business are rarely made with complete information. Finance teams project next quarter's revenue. Operations teams model inventory requirements. HR teams forecast headcount needs. Forecasting tools in excel support all of these tasks without requiring separate software.
What If Analysis
What If Analysis in Excel covers three tools: Goal Seek, Scenario Manager, and Data Tables.
Goal Seek works backwards from a target result. A Singapore startup modeling break even revenue would enter the target profit figure and ask Goal Seek to calculate the required sales volume automatically.
Scenario Manager saves multiple versions of a model with different input values. A finance team preparing optimistic, realistic, and conservative budget projections would save each version as a named scenario and switch between them for comparison.
Data Tables calculate results across a range of input values simultaneously. A loan officer comparing monthly repayments across 10 different interest rates would use a data table to generate all results in one operation.
Forecast Sheet
Excel's Forecast Sheet tool reads a time series data set and projects future values based on historical patterns. A Singapore retailer with 24 months of sales data can generate a 6 month forward projection with confidence intervals in under two minutes.
These advanced excel skills in forecasting do not replace professional financial modeling tools for complex scenarios. But for standard business planning tasks at team and department level, they produce structured outputs that support decision making without requiring external software or specialist skills.
How These Advanced Excel Skills Benefit Your Career
Singapore's job market for data related roles has become more specific about tool proficiency. A general “proficient in Microsoft Excel" resume entry no longer carries weight in shortlisting decisions for analyst, finance, or operations positions.
Job postings for data analyst, business analyst, finance executive, and operations manager roles in Singapore increasingly list specific Excel capabilities as required qualifications. Pivot tables, Power Query, dashboard creation, and advanced formulas appear as named requirements rather than implied skills.
Excel skills for career growth translate into measurable productivity differences that hiring managers and team leads can observe directly. A professional who can clean a 50,000 row data set in Power Query, summarize it with pivot tables, and present the results in a dashboard saves their team hours of manual work per reporting cycle.
For professionals already in accounting, operations, or administrative roles, advanced excel jobs in Singapore typically pay above the entry level range for the same function. The skill gap between basic and advanced Excel users is still wide enough that proficiency at the advanced level is a real differentiator in compensation and promotion decisions.
Adding structured advanced Excel training to a resume signals more than tool knowledge. It signals that the professional can handle data at volume, build repeatable processes, and present findings in a format that supports business decisions.
Tips for Learning Advanced Excel Faster
Structured learning produces faster results than unguided practice. These habits apply to anyone working through advanced Excel training topics independently or in a formal course:
Practice on data sets, not sample files. Generic practice sheets do not replicate the messy, inconsistent data that appears in actual workplace files. Using exports from accounting systems, CRM tools, or operations databases forces learners to apply skills in context.
Build dashboards from scratch. Copying existing dashboard templates teaches layout but not logic. Building from a blank sheet requires learners to connect every element, charts, slicers, pivot tables, and named ranges, and understand why each piece exists.
Automate one manual task per week. Identifying a repetitive task in a current workflow and rebuilding it in Power Query or with an advanced formula is faster than abstract exercises and directly relevant to the learner's job.
Use the Name Manager and named ranges. Advanced Excel users reference named ranges instead of cell addresses in formulas and charts. This habit makes files easier to read, easier to audit, and less prone to errors when rows or columns are added.
To learn advanced Excel online, free resources from Microsoft's official support library and structured course content from registered training providers in Singapore both cover the same core skill set. The difference is pacing, feedback, and structured sequencing.
Conclusion
Advanced Excel skills cover five areas that separate functional Excel users from professionals who can handle data at scale: advanced formulas and functions, pivot tables, Power Query, dashboard creation, and forecasting tools.
Each skill addresses a workplace problem. Lookups replace manual cross-referencing. Pivot tables replace hours of manual summarization. Power Query replaces repetitive copy paste preparation. Dashboards replace static reports. Forecasting tools replace manual projection calculations. Professionals who want to build all five areas through structured instruction can review the current schedule on the WSQ Microsoft Excel – Intermediate & Advanced Level page for available intake dates and fee details.
 +65 8421 2824
 info@exceltraining.com.sg


 Chat With Us