
Excel has been the default tool for data analysis in most workplaces for decades. Budgets, sales trackers, HR records, financial models; a huge share of business data still lives inside a spreadsheet. As data sets grow larger and reporting needs become more interactive, though, many professionals start looking at Power BI as the next step.
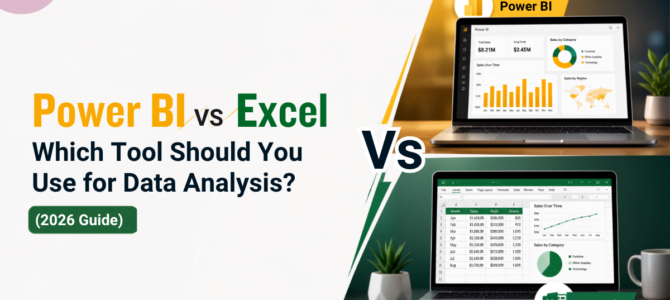
Power BI vs Excel isn't a question of one replacing the other. Both tools solve different problems, and understanding where each one fits makes for a far more efficient data analysis workflow than trying to force one tool to do everything. This guide walks through what each tool actually does, where they overlap, and how to decide which tool to use for data analysis in 2026.
What Is Microsoft Power BI?
Microsoft Power BI is built around a simple idea: connect to data wherever it lives, model it, and present it in a way that updates on its own rather than needing to be rebuilt every reporting cycle. It functions as a full business intelligence platform rather than a single tool, covering everything from data connection to the final dashboard a manager actually looks at.
At its core, Power BI brings together:
- Interactive dashboards that respond to clicks, filters, and drill-downs instead of sitting as a static image.
- Data visualisation built for spotting trends and outliers faster than a table of numbers ever could.
- Reports that combine several visuals into a single connected view of a business area.
Real-time analytics, refreshing data automatically as source systems update. - Multiple data sources connected at once, from Excel files to databases to cloud services.
Key Features of Power BI
- Interactive dashboards where clicking one chart filters every other visual on the page automatically.
- Automatic data refresh, pulling updated numbers from connected sources without manual re-import.
- Data visualisation options covering bar charts, maps, KPI cards, and custom visuals well beyond what a standard Excel chart offers.
- Multiple data connections, including Excel files, SQL databases, cloud services, and web sources, all in one report.
- Drill-down reports that let a viewer click from a yearly total down into monthly, then daily, detail.
- Cloud sharing, publishing a report once and distributing it to a team through the Power BI service instead of emailing a file back and forth.
What Is Microsoft Excel Used For?
Excel remains one of the most widely used tools for day-to-day business tasks, and for good reason. It's the spreadsheet software most people already know, and it covers a broad range of work:
- Data entry, capturing raw numbers, records, and transactions as they happen.
- Calculations, from a simple total to a multi-step financial model.
- Formulas, handling everything from basic arithmetic to lookups across large tables.
- PivotTables, summarizing thousands of rows into a readable breakdown in a few clicks.
- Charts, building quick visuals directly alongside the underlying data.
- Financial analysis, including budgeting, forecasting, and variance tracking.
For a single analyst working through daily numbers, formulas, or a one-off budget, Excel usually gets the job done faster than setting up a full Power BI report would.
Power BI vs Excel: Understanding the Main Differences
|
Feature |
Excel |
Power BI |
|
Data Size |
Best for smaller, manageable data sets |
Built to handle much larger volumes without slowing down |
|
Dashboards |
Basic charts and static summaries |
Fully interactive dashboards |
|
Visualization |
Standard chart types |
Wide range of visuals, including custom and map-based options |
|
Collaboration |
Shared through file copies or cloud storage |
Published and shared through the Power BI service |
|
Automation |
Limited, mostly manual refresh |
Scheduled, automatic data refresh |
|
Data Sources |
Primarily manual import |
Connects to many sources simultaneously |
|
Refresh |
Manual, file by file |
Automated, across connected sources |
When Should You Use Excel?
Excel remains the better choice for a specific set of everyday situations:
- Budget planning, especially when a template already exists and only needs updating each period.
- Financial calculations involving formulas, what-if scenarios, or a model built for one specific purpose.
- Small data sets that don't need a connected model or automatic refresh.
- Ad hoc analysis, a quick question that needs an answer today, not a report built for repeat use.
- Daily office work, tracking, logging, or reporting that lives entirely inside one file.
- Formula-heavy workbooks, where the value comes from the calculations themselves rather than the visuals around them.
When Should You Use Excel?
Excel remains the better choice for a specific set of everyday situations:
- Budget planning, especially when a template already exists and only needs updating each period.
- Financial calculations involving formulas, what-if scenarios, or a model built for one specific purpose.
- Small data sets that don't need a connected model or automatic refresh.
- Ad hoc analysis, a quick question that needs an answer today, not a report built for repeat use.
- Daily office work, tracking, logging, or reporting that lives entirely inside one file.
- Formula-heavy workbooks, where the value comes from the calculations themselves rather than the visuals around them.
When Should You Use Power BI?
Power BI tends to earn its place once reporting moves beyond a single file or a single person:
- Business dashboards meant to be checked regularly by more than one person.
- Executive reporting, where leadership needs a high-level view refreshed automatically.
- Large data sets that would slow Excel down or exceed what a worksheet can comfortably hold.
- Multiple data sources that need to be combined into one connected view.
- Sales analytics, tracking performance across regions, products, or teams.
- Financial reporting built for business reporting across departments rather than a single spreadsheet.
- Marketing analytics, connecting campaign data from several platforms.
- KPI tracking, where the same set of numbers needs monitoring on an ongoing basis rather than a one-time calculation.
Can Power BI and Excel Work Together?
This is where the comparison stops being an either-or question. Power BI doesn’t replace Excel, and in practice, many businesses use both side by side, each covering the part of the workflow it handles best.
Excel can act directly as a data source for Power BI, meaning a workbook already in use doesn’t need to be abandoned; it simply feeds into a Power BI report. Power Query, the same tool used for cleaning data inside Excel, exists inside Power BI as well, so the cleaning and transformation steps carry over between the two. Power Pivot’s data modeling concepts, tables, relationships, and calculations map closely onto how Power BI builds its own models, which makes the transition smoother for anyone already comfortable with that side of Excel.
Understanding Excel fundamentals makes it easier to organize data before importing it into Power BI in the first place. Once the data is clean and structured, refreshing a Power BI report becomes a matter of updating the connected source rather than rebuilding the file from scratch.
Examples of Using Excel and Power BI Together
- Sales Team: raw transaction data gets entered and cleaned in Excel, then connected into a Power BI dashboard showing revenue by region, product, and rep, refreshed automatically each week.
- HR: attendance and payroll data collected in Excel across departments feeds into a Power BI report tracking headcount and leave trends over time.
- Finance: budget and actuals live in Excel workbooks, while Power BI pulls that data into a variance report leadership can check without opening a spreadsheet.
- Marketing: campaign data exported from several ad platforms gets consolidated in Excel first, then visualized in Power BI to compare performance across channels.
- Operations: inventory and shipment logs tracked in Excel connect into a Power BI dashboard monitoring stock levels across multiple warehouses.
The pattern repeats across all five: Excel → Clean Data → Power BI Dashboard. Excel handles the entry and cleanup, Power BI handles the ongoing, shared view of the result.
Common Misconceptions About Power BI
- “Power BI replaces Excel." It doesn’t. Most organizations that adopt Power BI keep using Excel for the tasks it already handles well.
- “Power BI requires coding." Basic reports and dashboards can be built entirely without code. DAX, Power BI’s calculation language, only becomes necessary for more advanced measures.
- “Power BI is only for data scientists." Business users across finance, sales, HR, and operations build Power BI reports regularly without a technical background.
- “Power BI only creates charts." Charts are one part of it. The bigger value sits in the data modeling and refresh automation behind those charts.
- “Power BI cannot work with Excel." Excel is one of the most common data sources Power BI connects to directly.
How to Decide Between Excel and Power BI
|
Situation |
Better Choice |
|
Small dataset |
Excel |
|
Interactive dashboard |
Power BI |
|
Budget planning |
Excel |
|
KPI monitoring |
Power BI |
|
Daily calculations |
Excel |
|
Business reporting |
Power BI |
Users who are already comfortable with formulas, PivotTables, and advanced spreadsheet techniques often find it easier to transition to Power BI, since the underlying logic, tables, relationships, and calculations carry over directly.
Conclusion
Excel and Power BI both do their own job well. Excel is good for calculations, spreadsheets, and daily data work. Power BI is good for dashboards, reports, and looking at data from a bigger, connected view. The right choice depends on what the task needs, not on picking one tool for everything. For anyone who wants to learn Power BI step-by-step, this Power BI course in Singapore covers the basics through building real dashboards.
 +65 8421 2824
 info@exceltraining.com.sg


 Chat With Us